Easy Site Benchmarking[Benchmark][Web]
Easy Site Benchmarking
http://public.e-tunity.com/sitebenchmark/sitebenchmark.html
http://freshmeat.net を見てて見つけた Perl で作られた Web benchmark。グラフ描写用に、gnuplot 用のデータを吐き出させることも可能です。
$ tar zxvf sitebenchmark.tar.gz
$ cd sitebenchmark
$ su
# make install
で、/usr/local にインストールされる。もしインストール先を変えたければ
# export EBASE=/usr
# make install
と、環境変数で設定する。必要とされる Perl モジュールは
- Getopt::Std
- IO::Socket::INET
- Time::HiRes
の3つ。その他には、gnuplot が必要。
実行例
$ echo 'GET /' | sitebench -v 5 100 192.0.2.1 80 Welcome > bench.log
上記の例だと、192.0.2.1 の 80 ポートへ "GET /" のリクエストを発行することになります。掛ける負荷は、同時接続数 5で、そのクライアント毎に100リクエストを投げることに。またリクエストの成功は、"Welcome" がレスポンスに含まれているかどうかで判断されます。
で、ある実験用サーバで試した結果が以下
bench.log
5327 1 0.07574 1 0.022984
5327 1 0.039719 1 0.255656
〜中略〜
5331 1 0.052004 1 0.024625
5331 1 0.050035 1 0.023592
5331 1 0.050952 1 0.023404
5331 1 0.052174 1 0.023401
実際には、テスターとして、かなり非力なクライアントを使ったので、そっちの影響の方が大きいかも?
これを sitecollect に掛けます。
$ sitecollect <bench.log
Analysis Overview
Failed connects: 0
Succeeded connects: 500
Mean successful connect time: 0.046193328
SD successful connect times: 2.23098586457074e-05
Failed matches: 0
Mean failed match request time: 0
SD failed match times: 0
Succeeded matches: 500
Mean succeeded match time: 0.024235006
SD succeeded match times: 0.000113374238827619
Mean total processing time: 0.070428334
SD total processing time: 0.000135791207709864
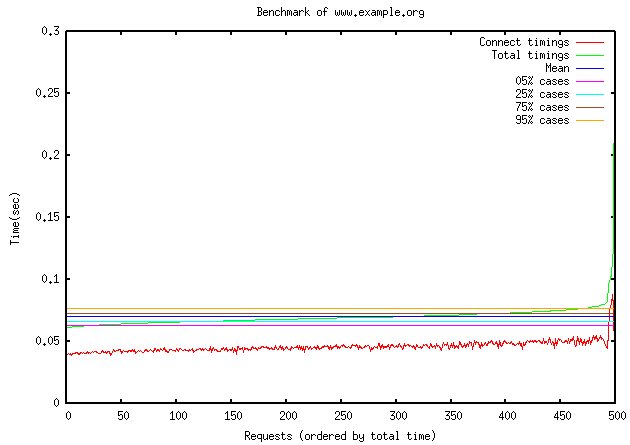
で、siteplot で、gnuplot 用のコマンドファイルを吐き出させます。
$ siteplot 'Benchmark of www.example.org' graph <bench.log
Collecting data..
500 successes collected, sorting..
5% occurs at index 405, value 0.063377
25% occurs at index 23, value 0.066454
75% occurs at index 454, value 0.072567
95% occurs at index 145, value 0.077346
ちなみに、データが少なすぎると
$ siteplot 'Benchmark of www.mysite.org' graph <bench.log
Collect ing data..
0 successes collected, sorting..
Can't use an undefined value as an ARRAY reference at /usr/local/bin/siteplot line 96, <STDIN> line 20.
こんな感じでエラーが出たり。それはさておき、これを gnuplot に食わせます。
$ gnuplot
gnuplot> load 'graph.gnuplot'
ん〜 ab よりはいいんだろうなぁ。もうちょっと負荷を掛けた状態で試さないとだめかも。もうちょっと負荷をしっかり掛けられるぐらいのCPUを持ったクライアントで試してみよう(^_^;
| IPv4/IPv6 meter |
検索キーワードは複数指定できます
| 思ったより安い……時もある、Amazon |
カテゴリ
- Ajax (14)
- Amazon (1)
- Apache (28)
- Backup (4)
- Benchmark (5)
- Blog (3)
- Book (22)
- C (10)
- CGI (2)
- CPAN (8)
- CSS (2)
- Catalyst (8)
- CentOS (2)
- Chalow (11)
- CheatSheet (3)
- Computer (2)
- Crowi (1)
- DB (8)
- DBIC (10)
- DNS (6)
- Debian (31)
- Design (5)
- Django (9)
- Docker (7)
- Emacs (22)
- English (13)
- Excel (3)
- FileSystem (3)
- Firefox (19)
- Flash (2)
- Food (25)
- Framework (3)
- GTD (4)
- Gadget (6)
- Gmail (1)
- Google (19)
- HTML (2)
- Hacker (1)
- Health (22)
- Howto (5)
- IBM (3)
- IETF (2)
- IPv6 (45)
- JANOG (9)
- Java (8)
- Javascript (27)
- LDAP (4)
- Language (4)
- Life (4)
- Lifehack (3)
- Linix (1)
- Linux (127)
- Lisp (2)
- Mac (8)
- Mail (3)
- Manuscript (1)
- Monitoring (1)
- Munin (1)
- MySQL (23)
- Network (19)
- PHP (13)
- Perl (69)
- PostgreSQL (8)
- Programing (5)
- Python (42)
- RPM (1)
- RSS (4)
- React (1)
- RedHat (2)
- Regexp (3)
- Ruby (9)
- Samba (1)
- Scheme (3)
- Security (53)
- Server (4)
- Shell (6)
- Storage (6)
- Subversion (9)
- TAG (2)
- TIPS (26)
- TLS (1)
- Test (6)
- ThinkPad (9)
- Tomcat (3)
- Tools (18)
- Trac (9)
- Troubleshooting (2)
- Tuning (6)
- VMware (12)
- VPN (2)
- Vault (4)
- Vim (3)
- Vmware (5)
- VoIP (1)
- Vyatta (2)
- Web (28)
- WiFi (2)
- Wiki (3)
- Windows (10)
- XML (2)
- XSLT (1)
- Xen (2)
- XenServer (11)
- Zabbix (1)
- junoser (1)
- linkdraw (1)
- python (1)
- raspberry (2)
- skark (1)
- ssh (4)
- systemd (1)
- あとで読む (5)
- その他 (67)
- よもやま (29)
- アサマシ (24)
- イベント (4)
- ゲーム (1)
- ストリーム (2)
- セマンティック (1)
- ダイエット (1)
- ネタ (98)
- 仮想化 (11)
- 開発 (73)
- 環境 (3)
- 管理 (7)
- 休暇 (5)
- 携帯 (8)
- 検索 (3)
- 酒 (3)
- 小物 (10)
- 投資 (1)
- 文字コード (6)
- 勉強会 (1)